
Reports and analytics · CRMDAY One
The numbers your agency runs on, and the records behind them.
Build reports over your own data and turn them into dashboards of animated KPIs. Every number is clickable: open the policies, contacts or deals that produced it instead of trusting a chart.
KPI templates
Seven ways to show a number that matters.
Pick the visual template, point it at the data and the wizard builds the KPI. Each one animates when it enters the screen and opens the records behind it when clicked.
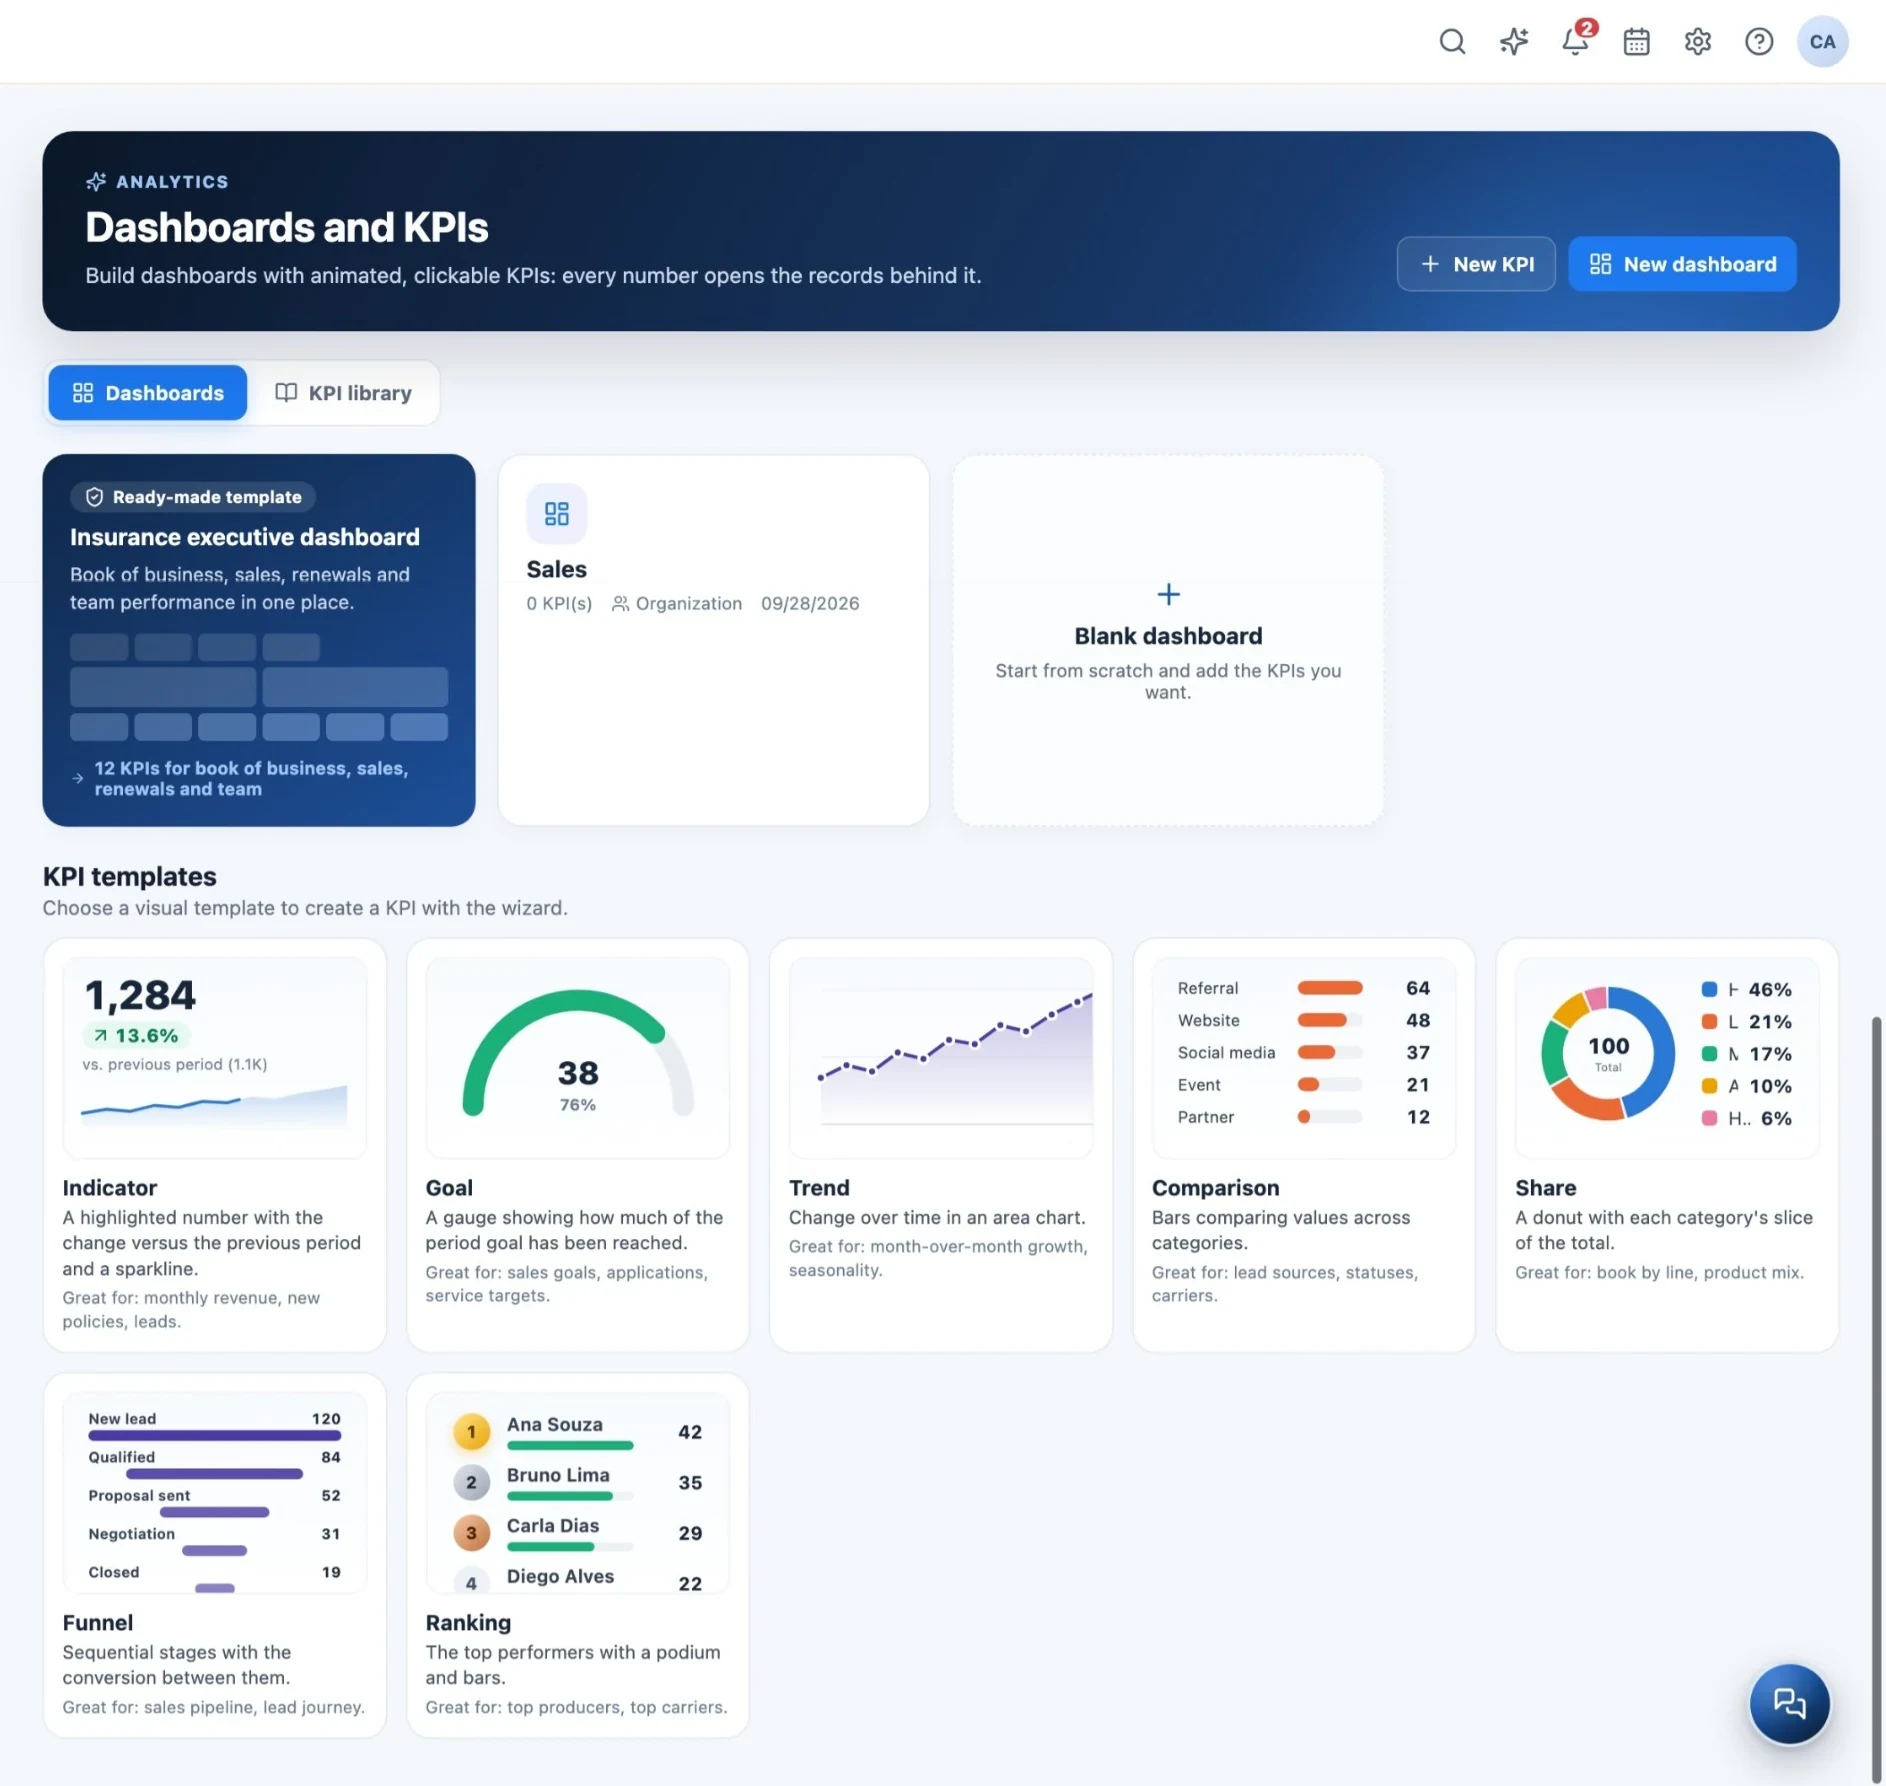
Indicator
A highlighted number with the change versus the previous period and a sparkline.
Monthly revenue, new policies, leads.
Goal
A gauge showing how much of the period goal has been reached.
Sales goals, applications, service targets.
Trend
Change over time in an area chart.
Month-over-month growth, seasonality.
Comparison
Bars comparing values across categories.
Lead sources, statuses, carriers.
Share
A donut with each category's slice of the total.
Book by line, product mix.
Funnel
Sequential stages with the conversion between them.
Sales pipeline, lead journey.
Ranking
The top performers with a podium and bars.
Top producers, top carriers.
Report builder
Start with a question. Finish with a report.
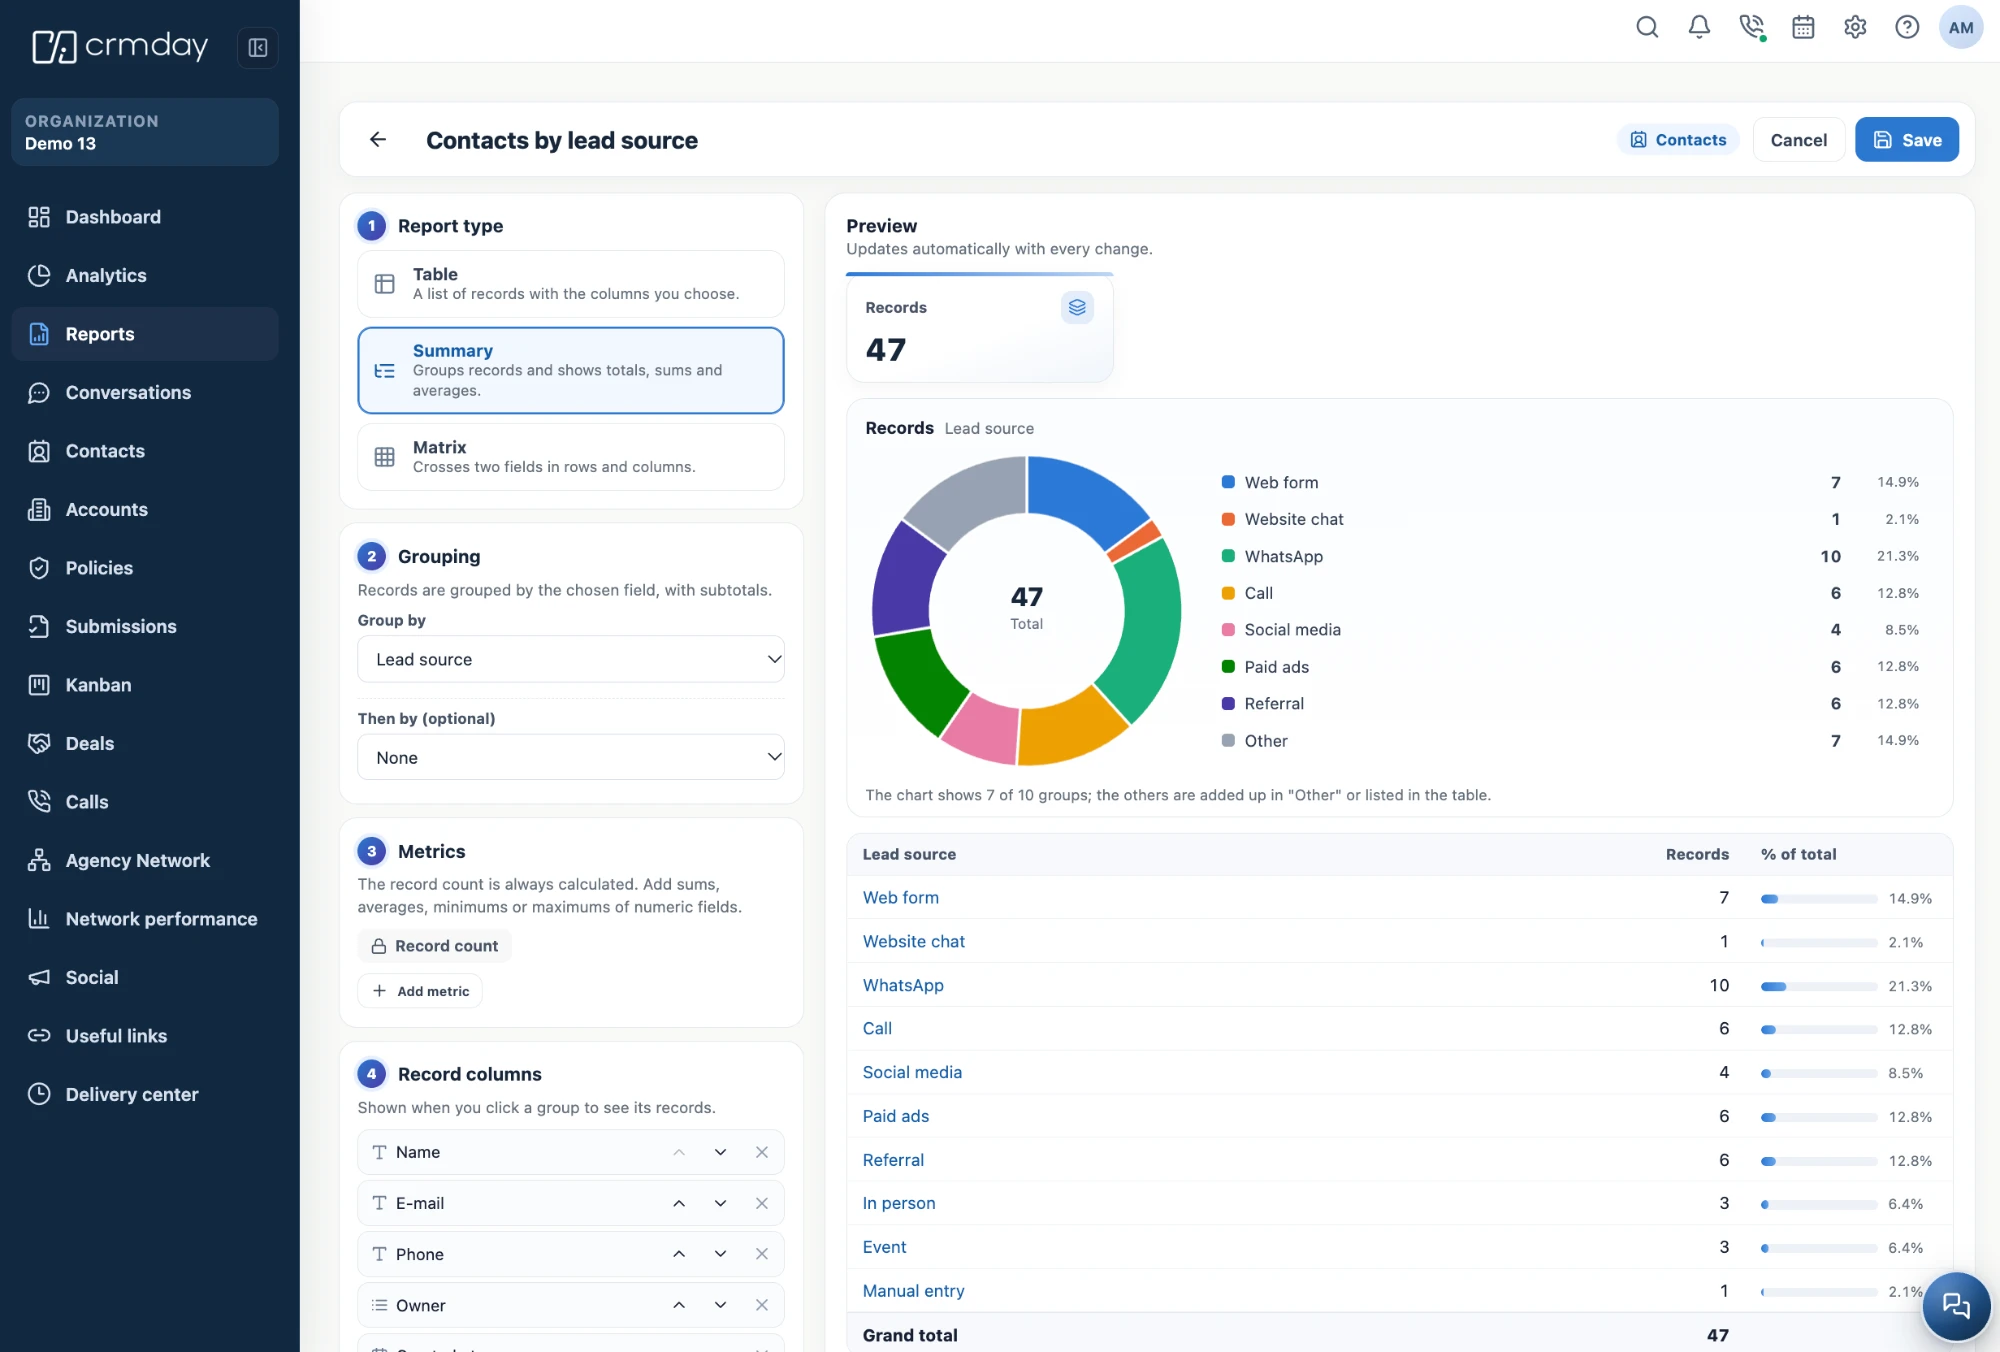
Choose the records, group them, add the metrics and read the result while you build: the preview updates with every change, and clicking a group opens the records inside it.
Table
A list of records
The records you filtered, with the columns you choose.
Summary
Grouped with subtotals
Group by a field and read totals, sums and averages per group.
Matrix
Two fields crossed
Rows and columns crossing two fields, for the view a list cannot give.
Metrics
More than a count
Record count always comes along; add sums, averages, minimums and maximums of numeric fields.
Drill-down
Click the number
Open a group and see the records behind it, with the columns your team needs.
Catalog
Your own fields
Reports run over the same catalog the CRM uses, including fields your agency created.
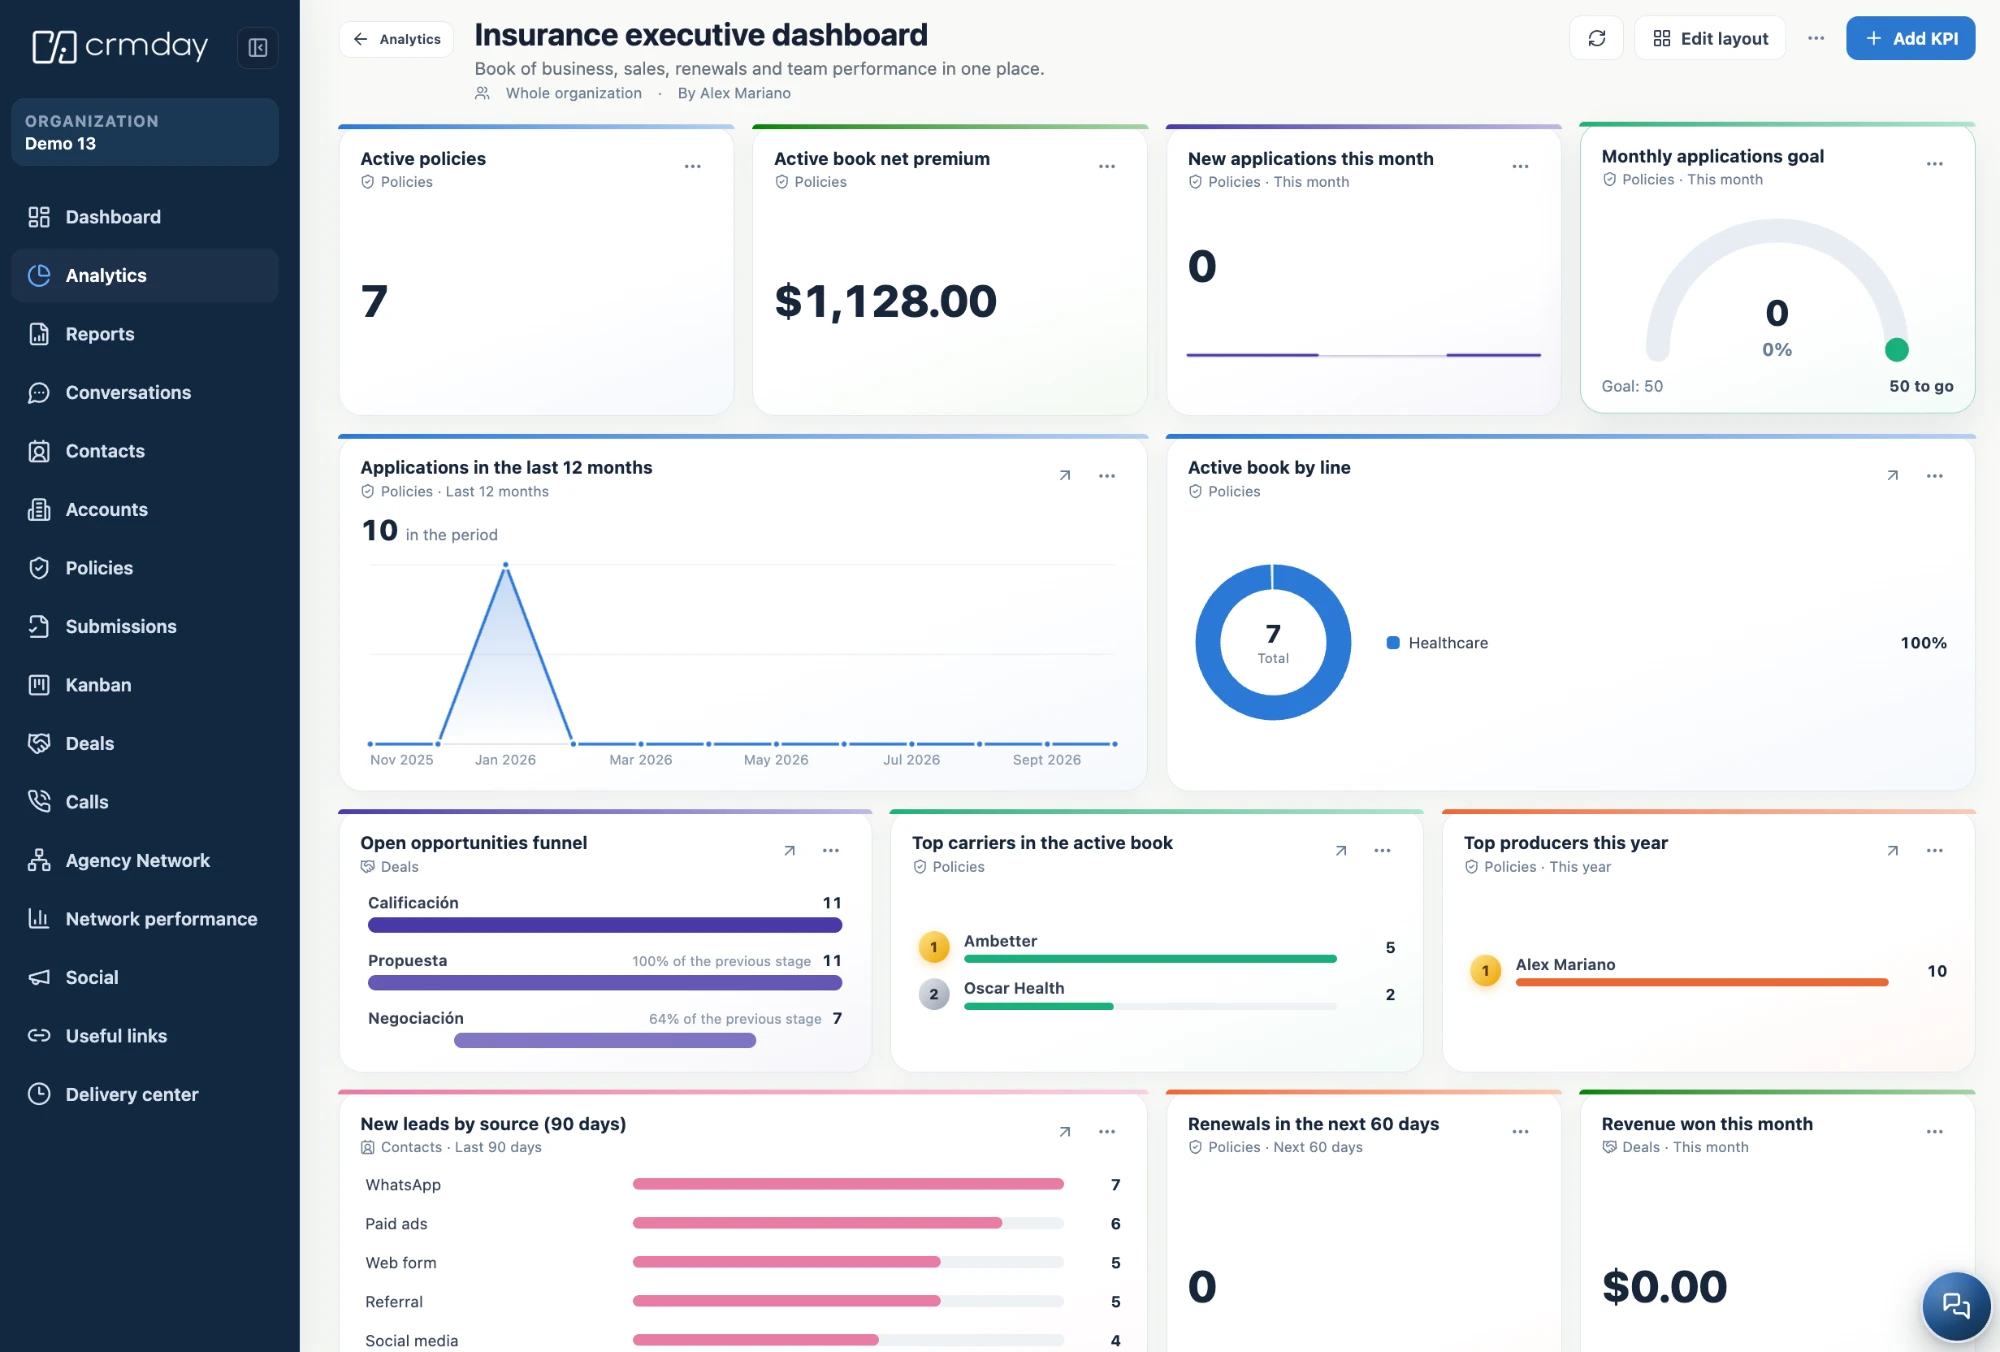
Dashboards
The dashboard your agency opens every morning.
Start from the ready-made insurance dashboard or from a blank one, drag the KPIs into the layout you want and share it with the organization.
Template
Insurance executive dashboard
Twelve KPIs for book of business, sales, renewals and team, ready on the first day.
Blank
Build your own
Start from scratch and add only the indicators your operation argues about.
Layout
Arrange it your way
Edit the layout, resize the cards and keep the important number at the top.
Scope
Organization or team
A dashboard for the whole organization or for the slice a team is responsible for.
What agencies measure
Four questions every Monday.
The dashboard that works is the one that answers what the team already argues about.
- 1Book
How is the book doing?
Active policies, net premium, book by product line and top carriers.
- 2Sales
What is in the pipeline?
Open opportunities by stage, conversion between stages and revenue won this month.
- 3Renewals
What is coming up?
Renewals in the next 60 days, applications in the period and the goal for the month.
- 4Team
Who is producing?
Top producers, new leads by source and the performance of each agency in the network.
Connected workflows
Numbers are only useful next to the work.
What are reports and analytics in an insurance CRM?
Reports answer a specific question over your records — which contacts came from each source, which policies renew next month — and analytics turns those answers into the dashboard your team reads every day.
The difference that matters is drill-down: a number you can click until you reach the records behind it is a number your team will act on, not one they will argue about.
FAQ
Reports and analytics in CRMDAY One.
Do I need to export to a spreadsheet to analyze my data?
No. Reports are built and read inside the CRM, over the same records your team works on, so the numbers are current and clicking them opens the records behind them.
What kinds of report can I build?
Table, for a list of records with the columns you choose; summary, which groups records and shows totals, sums and averages; and matrix, which crosses two fields in rows and columns.
Which visual KPIs are available?
Indicator, goal, trend, comparison, share, funnel and ranking. You pick the template, choose the data and filters, preview the result and add it to a dashboard.
Is there a dashboard ready for insurance?
Yes. The insurance executive dashboard comes with twelve KPIs for book of business, sales, renewals and team, and you can edit, remove or rearrange any of them.
Can I see the records behind a number?
Yes, and this is the point: every KPI and every group in a report opens the policies, contacts or deals that produced the number.
CRMDAY One · free trial
Stop reporting on the agency. Start running it.
Put the numbers your team argues about on one dashboard, with the records one click away.
No credit card required